Mass Spectrometry for Peptide Identity: Reading the Spectrum on a COA
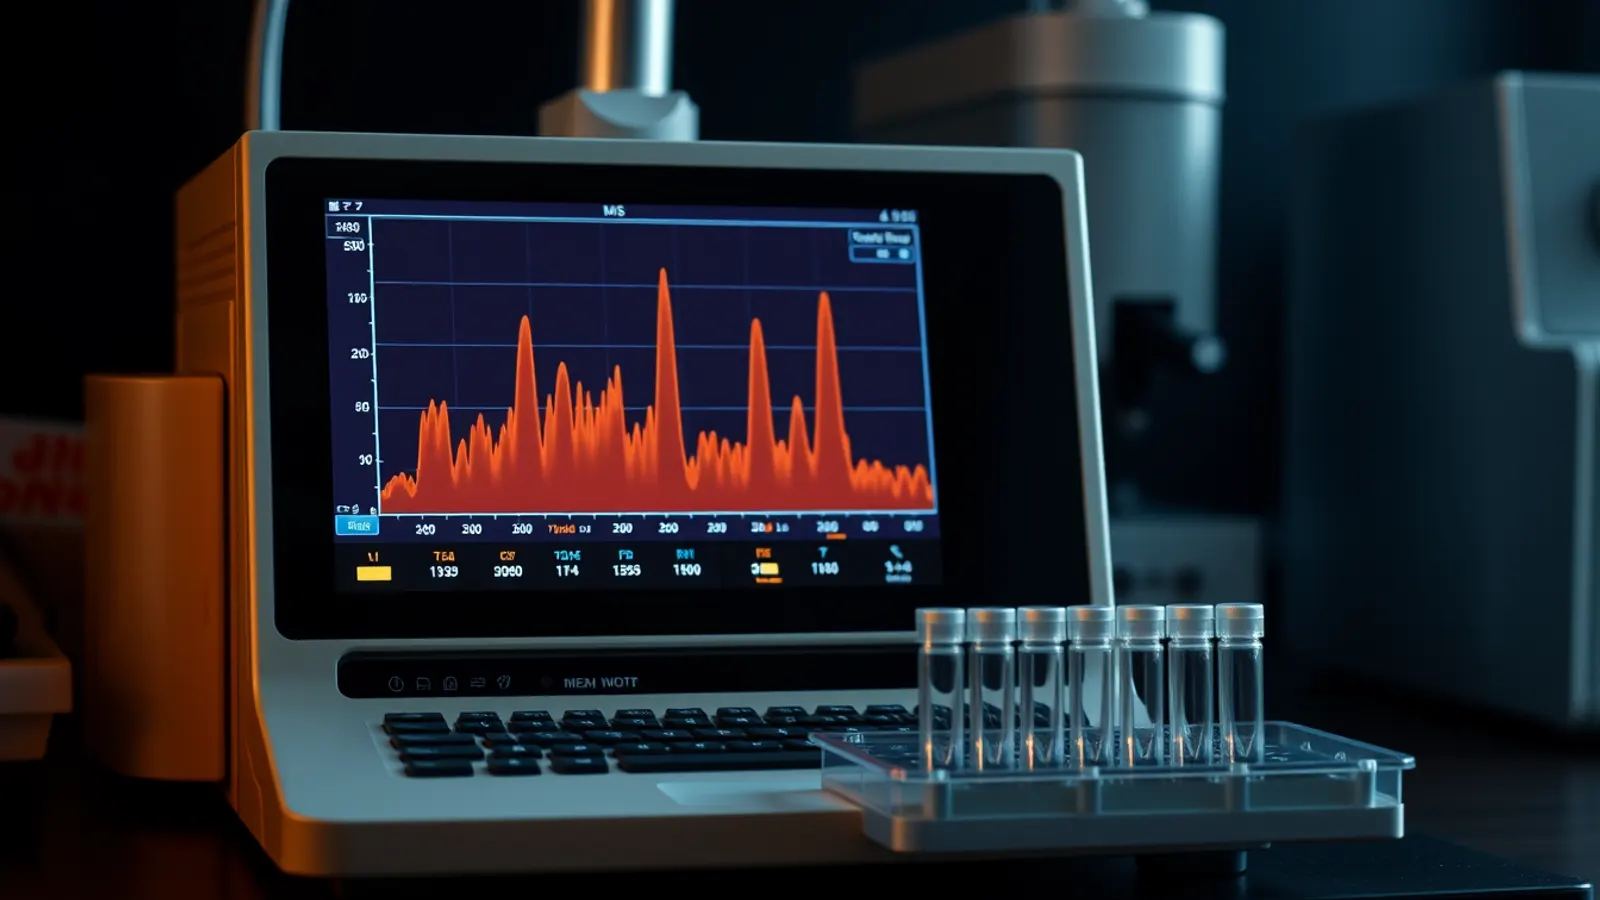
Mass spectrometry peptide identity testing is the half of a certificate of analysis that answers "is this the right molecule?" HPLC can show that a sample is dominated by one component, but it cannot say what that component is. A mass spectrometer weighs molecules, and because every peptide sequence has a calculable mass, comparing what the instrument observes with what the sequence predicts is the standard identity check for research peptides. This guide explains how the measurement works and how to read the spectrum on a certificate.
Why identity needs a separate test
A reversed-phase chromatogram ranks components by hydrophobicity and reports their relative areas, as covered in HPLC peptide purity explained. Two different peptides of similar hydrophobicity can leave the column at nearly the same time, so retention time alone is weak evidence of identity. Mass is a much more specific property. A missing amino acid, an extra one, an oxidised methionine or an incomplete deprotection each shifts the mass by a predictable amount, which makes mass spectrometry both an identity test and a diagnostic for the most common impurities.
How a peptide becomes an ion
A mass spectrometer measures the mass-to-charge ratio (m/z) of ions in the gas phase. Peptides are large, polar and fragile, so getting them into the gas phase intact was a long-standing problem. Two "soft" ionisation methods solved it in the late 1980s.
Electrospray ionisation (ESI)
In ESI, the peptide solution is sprayed through a fine, high-voltage capillary. Charged droplets shrink as solvent evaporates until intact, protonated peptide ions are released. The approach was described for large biomolecules by Fenn et al., 1989. ESI couples naturally to liquid chromatography, so a laboratory can run the HPLC separation straight into the mass spectrometer (LC-MS) and obtain a mass for each peak, not just the main one.
MALDI
Matrix-assisted laser desorption/ionisation mixes the sample with a light-absorbing matrix, dries it on a target plate and fires a laser at the spot. Karas and Hillenkamp, 1988 showed that the method could ionise proteins above 10,000 daltons. MALDI mostly produces singly charged ions, which gives simple spectra and makes it common for quick identity checks.
Charge states: why one peptide gives several peaks
ESI typically adds more than one proton to a peptide, especially longer sequences with several basic residues (lysine, arginine, histidine and the N-terminal amine). Each charge state appears at a different m/z value. For a peptide of neutral mass M carrying z protons, the observed value is (M + z × 1.00728) / z, where 1.00728 is the mass of a proton in daltons.
A worked example with a small, well-known sequence makes this concrete. The tripeptide glycyl-histidyl-lysine (GHK, the peptide part of GHK-Cu) has a monoisotopic neutral mass of about 340.19 Da, calculated by adding the residue masses of glycine, histidine and lysine plus one water. The singly protonated ion therefore appears near m/z 341.19, and the doubly protonated ion near m/z 171.10. Seeing both, at the predicted positions, is stronger evidence than seeing either alone. Software can "deconvolute" a series of charge states back to a single neutral mass, and many certificates report that deconvoluted value.
Monoisotopic vs average mass
Carbon, nitrogen, oxygen and hydrogen each have heavier natural isotopes, mainly carbon-13. A peptide therefore appears not as one line but as a small cluster of peaks spaced about 1 Da apart (divided by the charge). Two mass values can be quoted:
- Monoisotopic mass: the mass of the molecule made only from the most abundant isotopes. It is the first peak of the cluster and is used with high-resolution instruments.
- Average mass (often labelled molecular weight): the abundance-weighted mean across the cluster. It is what lower-resolution instruments effectively measure and what most datasheets list.
For a small peptide the two differ by well under a dalton; for a 40-residue sequence the difference grows to roughly a dalton or more. A certificate should state which one it compares. Matching an observed monoisotopic peak to a theoretical average mass, or vice versa, can make a correct result look wrong or hide a real discrepancy.
Mass accuracy and resolution
Resolution describes how well the instrument separates neighbouring m/z values; mass accuracy describes how close the observed value lands to the true one. High-resolution instruments (time-of-flight and Orbitrap analysers, for example) can resolve the isotope cluster and report masses within a few parts per million. Single-quadrupole instruments are less precise but still easily distinguish a correct sequence from one missing a residue, since the smallest amino acid, glycine, adds about 57 Da.
Reading mass shifts as impurities
Because common modifications have characteristic mass changes, an LC-MS run can identify many of the small peaks in a chromatogram:
| Observed shift from expected mass | Typical explanation |
|---|---|
| +16 Da | Oxidation, often of methionine |
| +1 Da (approximately 0.984) | Deamidation of asparagine or glutamine |
| Minus one residue mass (for example −57 for glycine) | Deletion sequence from an incomplete coupling |
| +22 Da or +38 Da | Sodium or potassium adduct, an artefact of the measurement |
| Protecting-group mass, such as +56 Da for tert-butyl | Incomplete deprotection after synthesis |
These pathways are discussed further in our article on peptide stability and degradation. One caution: deamidation adds less than one dalton, so it can sit inside the isotope cluster on a low-resolution instrument. Chromatography, which often separates deamidated forms, helps here.
Tandem MS: confirming the sequence, not just the mass
Two peptides with the same amino acids in a different order have exactly the same mass. To distinguish them, a laboratory can use tandem mass spectrometry (MS/MS). The instrument isolates one ion, breaks it by collision with an inert gas, and measures the fragments. Peptides tend to break along the backbone, producing two ladders of fragments: b ions that contain the N-terminus and y ions that contain the C-terminus. The mass differences between consecutive fragments correspond to individual residues, so the sequence can be read directly from the spectrum. Not every certificate includes MS/MS, but for longer or modified sequences it is the most complete identity evidence available.
What a credible spectrum on a certificate shows
- The theoretical mass, stated as monoisotopic or average, calculated from the sequence and any terminal modifications (for example a C-terminal amide).
- The observed mass or the observed charge-state peaks, with the spectrum itself shown, not just the word "conforms".
- The ionisation mode and instrument type.
- A lot number and date that match the HPLC report and the vial.
If a certificate shows a spectrum whose peaks do not fit any charge state of the stated mass, or a spectrum identical across different lots, treat it with suspicion. Our guide on how to spot a fake peptide COA describes these checks step by step.
Where mass spectrometry stops
MS confirms what is there; on its own it is a poor measure of how much. Ionisation efficiency varies between molecules, so peak heights in a mass spectrum do not translate directly into proportions. That is HPLC's job. MS also cannot easily tell D- from L-amino acids, since they have identical masses, which matters for sequences such as ipamorelin that contain D-residues by design. Chiral analysis is a separate, specialist method. And neither HPLC nor MS reports water or counterion content, which is why net peptide content is a distinct measurement.
Frequently asked questions
How does mass spectrometry confirm a peptide's identity?
It measures the mass-to-charge ratio of the peptide's ions. The laboratory converts those values to a neutral mass and compares it with the theoretical mass calculated from the sequence. A match, within the instrument's accuracy, supports identity.
Why are there several peaks for one peptide in an ESI spectrum?
Electrospray adds varying numbers of protons, so the same molecule appears at several m/z values, one per charge state. Each is also accompanied by a small isotope cluster.
Can mass spectrometry measure purity?
Not reliably on its own, because different molecules ionise with different efficiency. Purity is normally measured by HPLC with UV detection, while MS is used to identify the main peak and the impurities.
What is the difference between monoisotopic and average mass?
Monoisotopic mass uses only the most abundant isotope of each element; average mass is weighted across natural isotope abundances. A certificate should compare like with like.
See it in the catalogue: GHK-Cu with its lot certificate.
For laboratory research use only. Products sold by California Standard Peptides are not drugs, foods, supplements or cosmetics and are not for human or veterinary use. This article summarises published literature; it is not medical advice and not a usage guide.